

ELECTRICITY USAGE & QUALITY MEASURING DEVICE
OBJECTIVE
We were tasked with designing and building a device capable of performing high resolution and high frequency measurements of three-phase electrical networks. The original objectives were that the device should automatically detect different electrical anomalies occurring in the network and that the anomaly should be recorded and saved.
DEVICE
The device makes heavy use of galvanically isolated components due to dealing with high voltages. For each phase of the electrical network, there is a current and voltage measuring channel. Voltage measurement is performed using a voltage divider and an analog to digital converter, as seen below.
The current measuring channel consists of a current sensor, a digitally controlled potentiometer and an ADC. These three components allow for an adjustable measuring range. This is desirable since, unlike the voltage, the current amplitude can vary greatly. The current sensor coupled with a 1mΩ resistor is able to withstand up to 16 amperes of pass through current. The setup is shown below.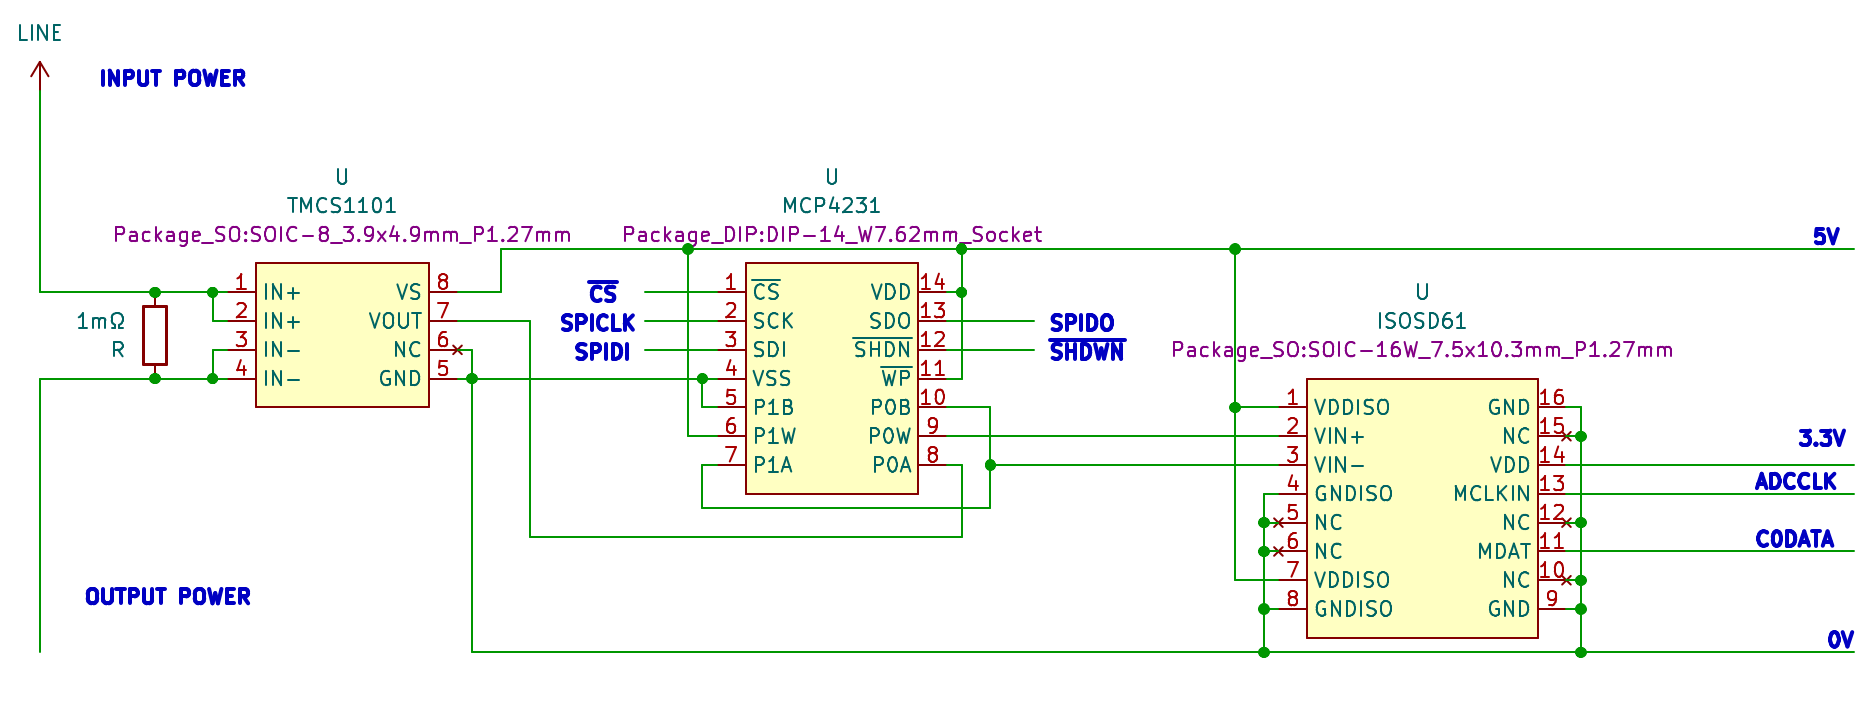
Since the galvanically isolated ADCs are sigma-delta modulators, an FPGA was used to sample the 24MHz modulators on all six channels. This is necessary since the 1-bit modulated data needs to be filtered into proper 16-bit measurement results in parallel. We had originally planned on using a WiPy 3.0 microcontroller for controlling the device and transmitting the data wirelessly. Due to development trouble however, these duties were split between the FPGA and an external PC.
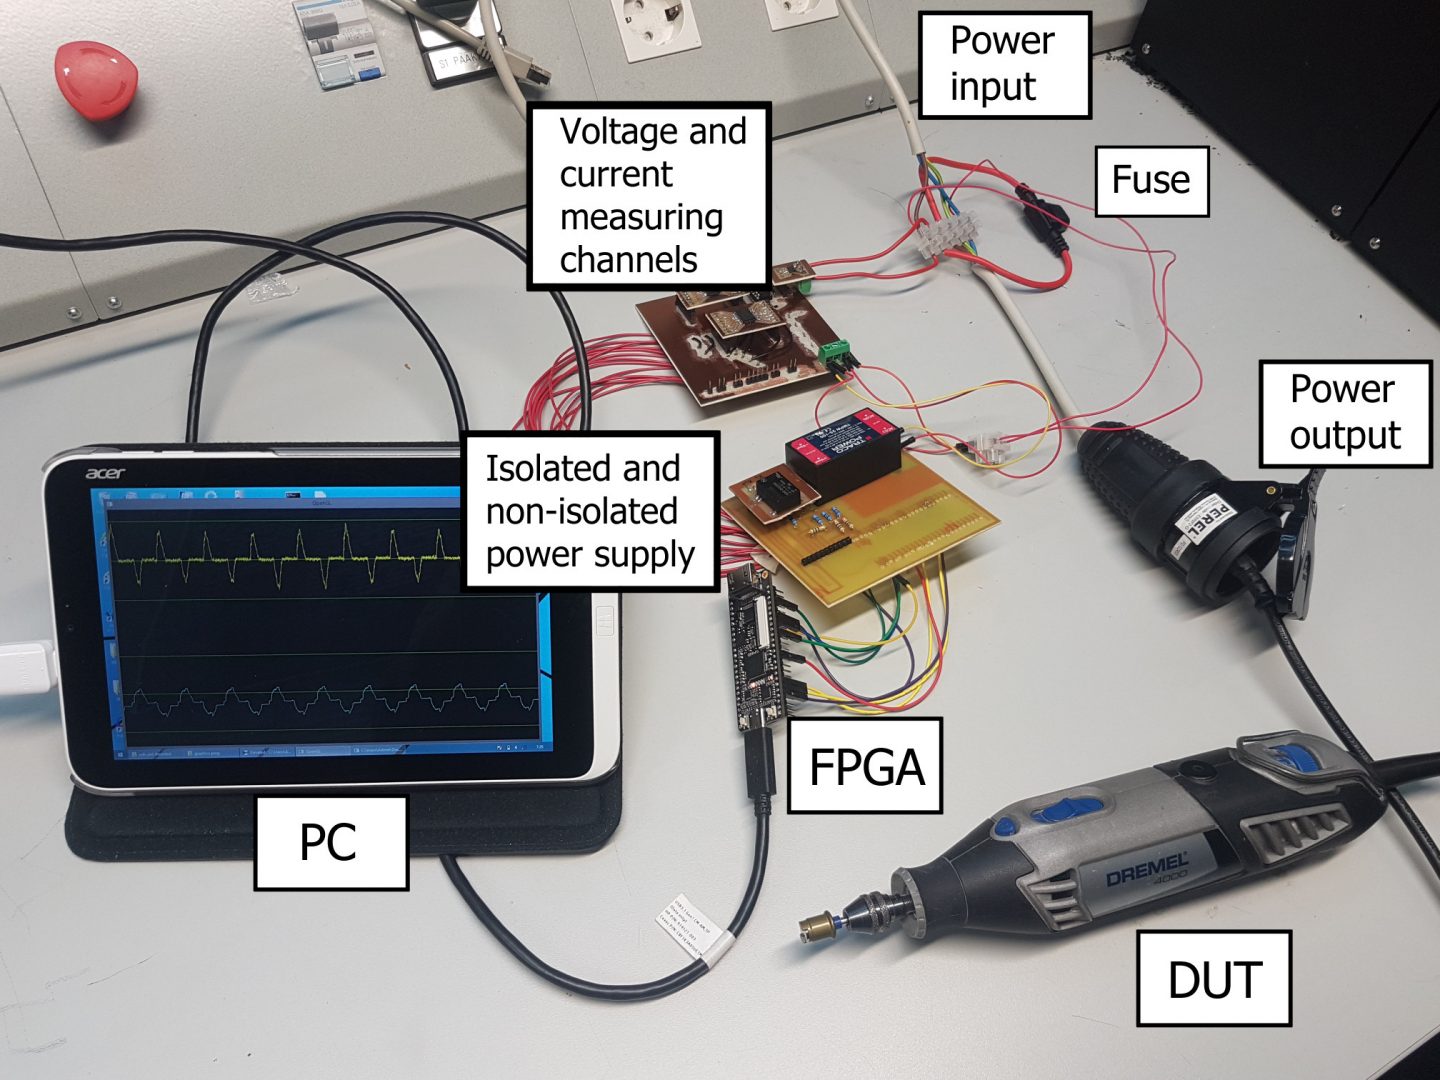
The measuring device consists of four PCBs. The first PCB houses an AC:DC converter, a DC:DC convertor, and an FPGA. The three remaining PCBs each house a voltage and current measuring channel. The figure below shows the device. Only one phase is connected, hence the two PCBs. However, the PC software and the FPGA design is functioning as if the device is measuring all three phases.
SOFTWARE
The software is a command line application where the user can adjust the wiper settings of the three potentiometers and save the received data to files. The original goal of having the device detect anomalies was not implemented due to running out of time. That being said, the PC software is receiving and processing all of the measurement data in real-time as the FPGA is sending it, meaning that if an anomaly detection function is written, then it should be trivial to integrate into the software. The measurements received by the software are 16-bit integers that are converted into floating point numbers in real-time. These floats should be scaled to proper amperes and volts based on calibration data but we were not able to gather this calibration data in time. A companion application was also written to read the saved files and render the data onto the screen. The images shown in the measurement results are from that application.
MEASUREMENT RESULTS
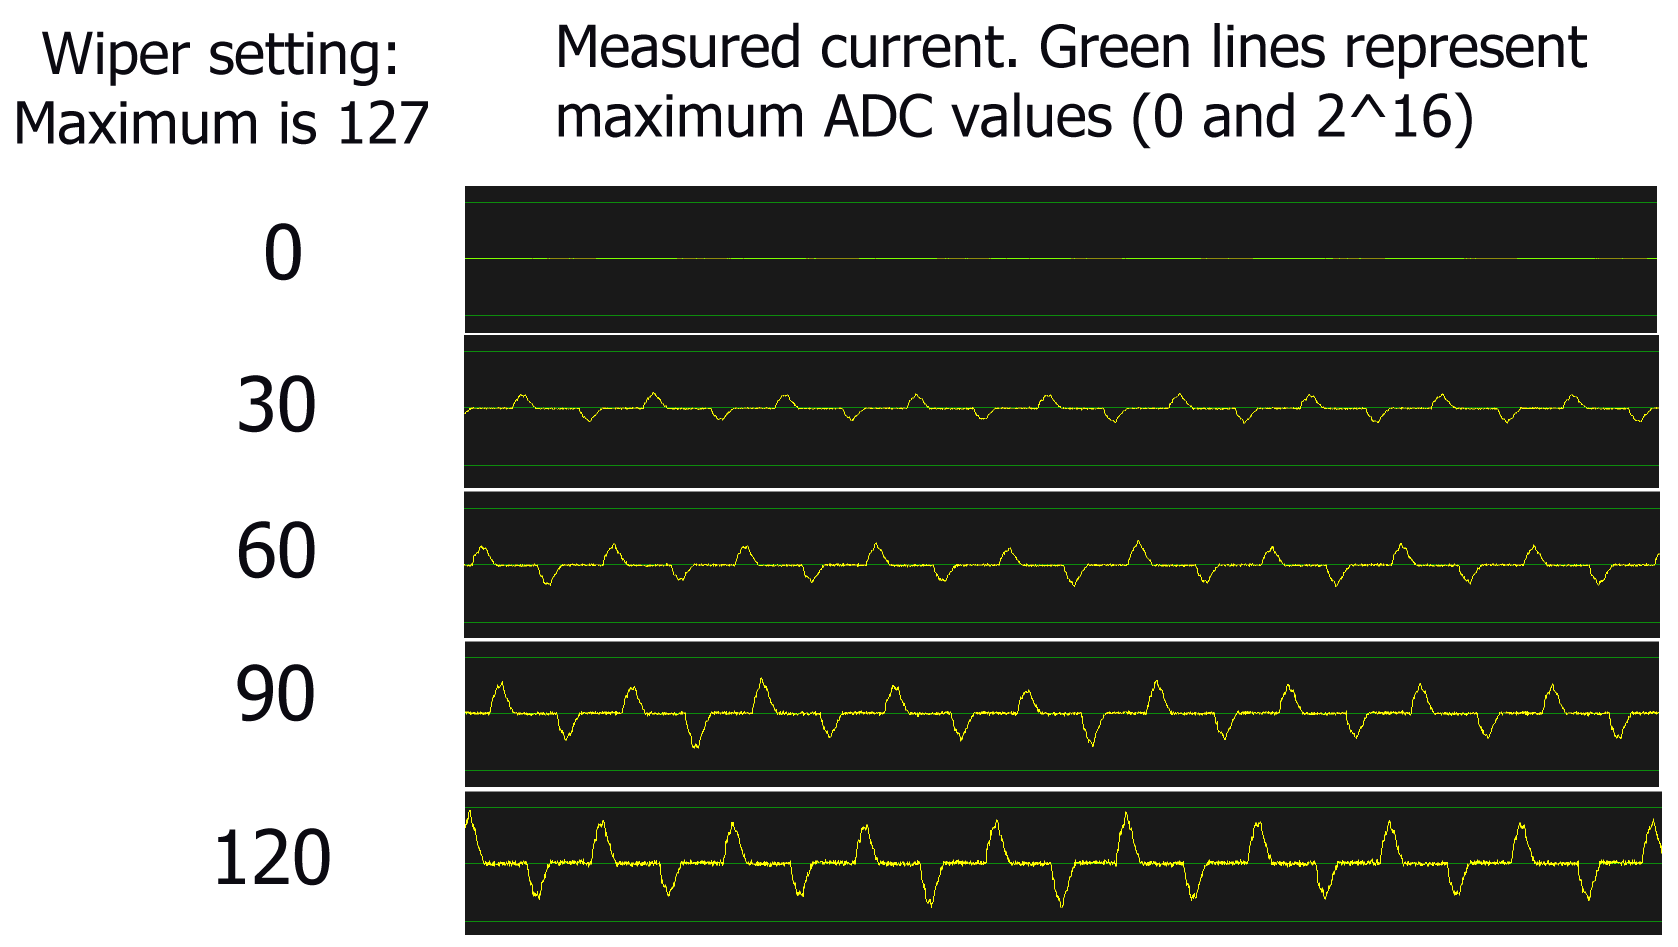
A sampling rate of 23.4kHz was used with a 16-bit measurement resolution on all six channels. A higher sampling rate should be possible although we did not have the time to test the absolute limits. The image below illustrates how the current measuring channel’s measuring range can be modified by changing the potentiometer’s wiper setting via the command line application. A higher wiper setting corresponds to higher resolution since the input signal is scaled to better fit inside the ADC’s voltage measuring range. The device being measured here is the dremel show in the picture above,
The image below shows an electric kettle being activated. The current is presented in yellow while the voltage is the blue signal. A visible change in the shape of the voltage curve can be seen. Strangely though, the voltage is shown as being mostly negative which should not be possible since the neutral line is connected directly to one of the ADC’s input terminals.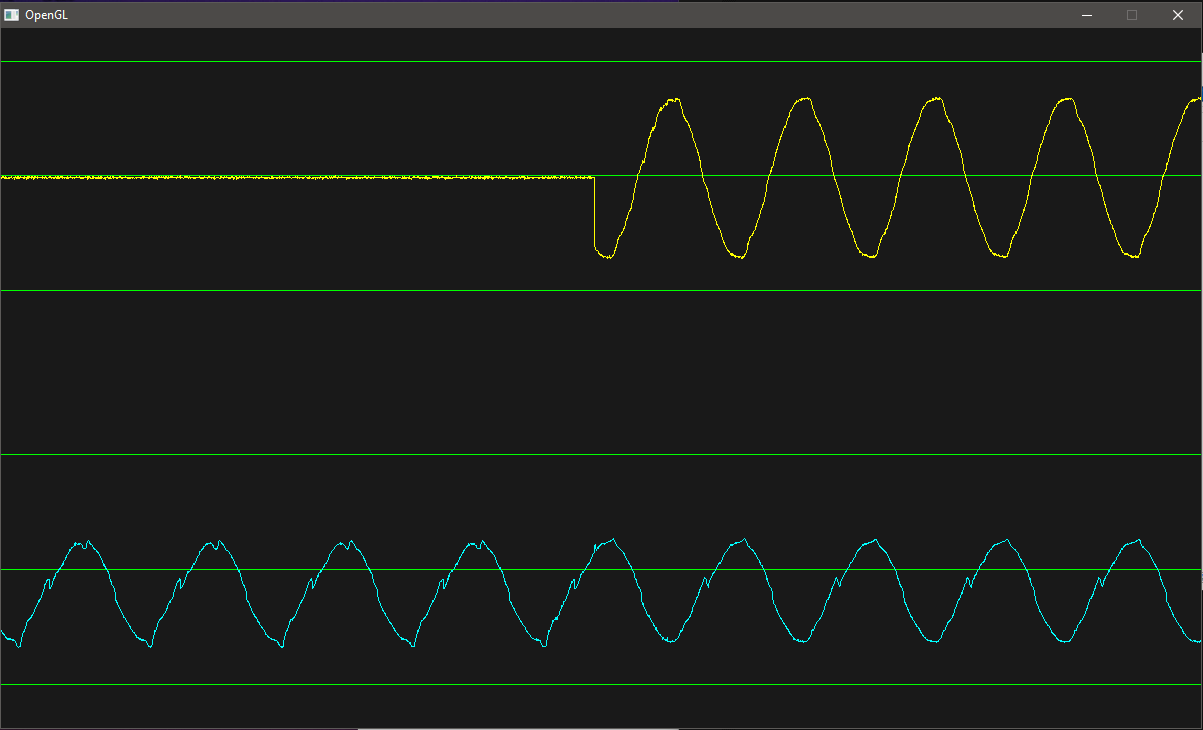
The figure below shows the voltage and current measurements of the same dremel as shown before. Here we see that the voltage curve is severely distorted during the current spikes. There is no way that the electrical network is this badly affected by a dremel, so there must be something in the device’s design that’s causing the distortion. Further research is required on the topic. 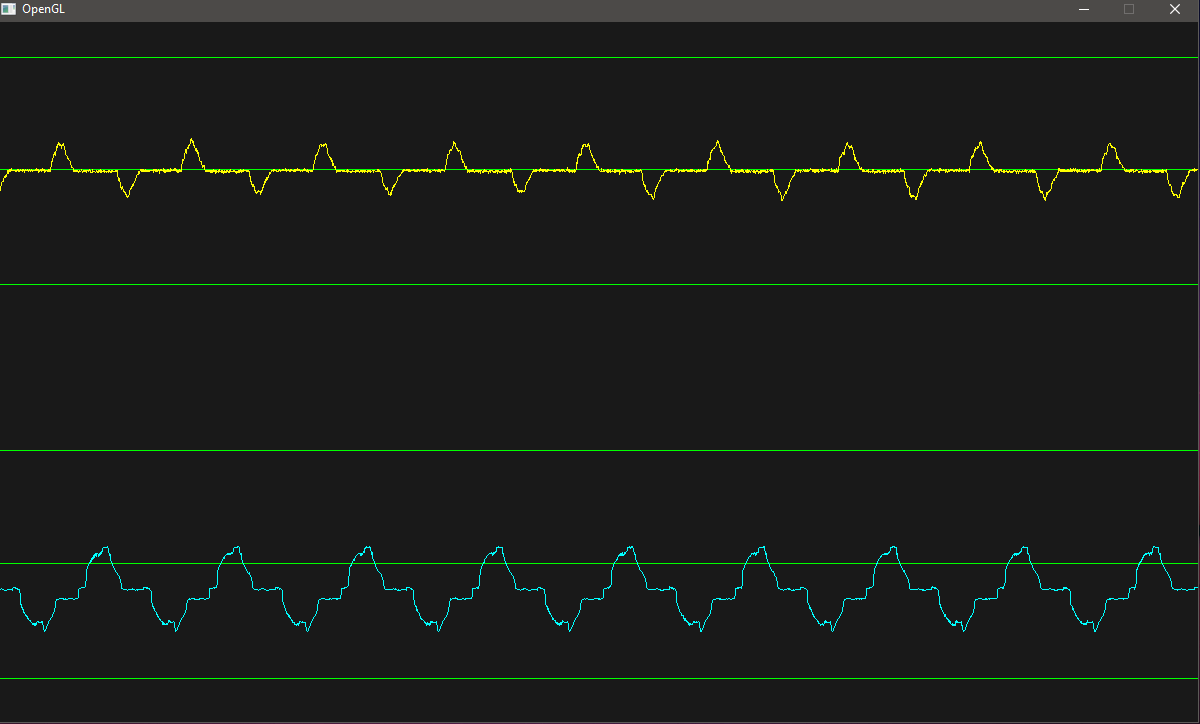
TEAM
- Anthony Reineck – Electrical Engineering
- Jaakko Hiidenheimo – Computational Engineering
- Lauri Lindh – Computational Engineering
- Vahe Babayans – Electrical Engineering
REPOSITORY – schematics, source code, FPGA project files & final report
- Project repository: https://version.aalto.fi/gitlab/ljlindh/protopaja-2022
- Final report: https://version.aalto.fi/gitlab/ljlindh/protopaja-2022/-/blob/main/Protopaja_Final_Report_-_Solita.pdf